
.svg)


Sommaire
When choosing a document data extraction solution, being able to perform an insightful and unbiased benchmark among different providers is important before drawing conclusions. Depending on the type of solutions you are testing, or the problem you are trying to solve, the process might differ because there is no generic and absolute benchmark strategy. Most receipt Optical Character Recognition (OCR) technologies rely on statistical approaches (like machine learning or deep learning), and performing benchmarks on those technologies must follow some important guidelines in order to get meaningful and unbiased insights leading to a decision. How does a receipt OCR work?
Click below to download Mindee's free OCR benchmark tool and start your evaluation today!
Download the Free OCR Benchmark Tool
How does a receipt OCR work?
Receipt OCR technologies extract data from images of expense receipts in a machine-encoded format that can be used in software applications. They are mainly used to automatically extract data from receipts in order to optimize or automate a manual process. Depending on the technology, the list of extracted fields can differ, but the main data points usually extracted are the amounts, taxes, date and time, and supplier information.
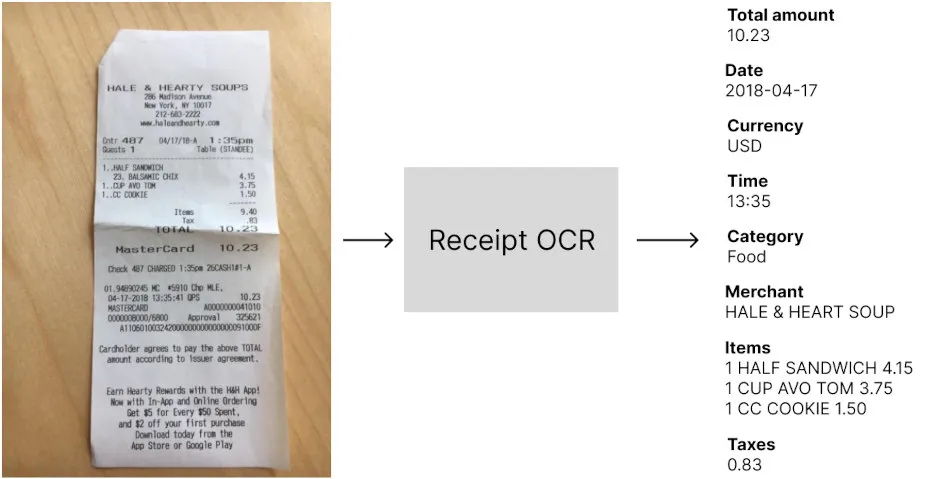
Evaluating a receipt OCR has many aspects, like the set of extracted fields, the pricing, and the extra features. We’ll focus in this article on the most important part of the benchmark that can help you understand how well it will perform in your applications, the technical performances:
- Extraction performances: the goal is to measure the impact of the technology on the optimization of the manual data entry process. By testing the OCR, you want to understand how many times the OCR outputs the right answer for the total amount, the date, etc… In other words, you want to specify performance metrics like accuracy, automation rate, precision, or any other relvant metric that matches your business goal.
- Speed: most expense management solutions offer real-time user experiences and it’s important to make sure that users will not wait before the receipt data are extracted. This benchmark should help you understand how long your users would wait before the data is extracted.
But because most receipt OCRs are built using statistical approaches that don’t behave the same way depending on the data, it’s very important to choose carefully the set of receipts used for evaluation.
Create a meaningful set of receipts for testing the OCR
This is definitely the most important part of the process because depending on the dataset you send to the OCR you might have different results and you want to make sure you are testing the solution on the same scope as your usage. And worse, if your data set is too small, you can get a measure of the accuracy that is not even close to the real accuracy you will see in production.
In other words, when performing your benchmark, you want to get an accurate and unbiased estimation of the performances of the OCR if you were to use it on your real-world use case.
“It's easy to lie with statistics, but it's hard to tell the truth without them.”
― Charles Wheelan Naked Statistics: Stripping the Dread from the Data
How many receipts to use in order to get an accurate estimation of the performances?
The problem of not having enough data in your test set
The rule of thumb is “the more data, the more accurate the benchmark is”, but that’s not really actionable. This is actually a very difficult question! But statistics offer an easy way to think about this question differently.
First, let’s think about a simple problem. You have 11 receipts in your data set, and for each of those receipts, you have the corresponding total amount that you’ve written in a spreadsheet (We’ll talk about this later: Annotating the receipt data set). An illustration of your data is something like this:
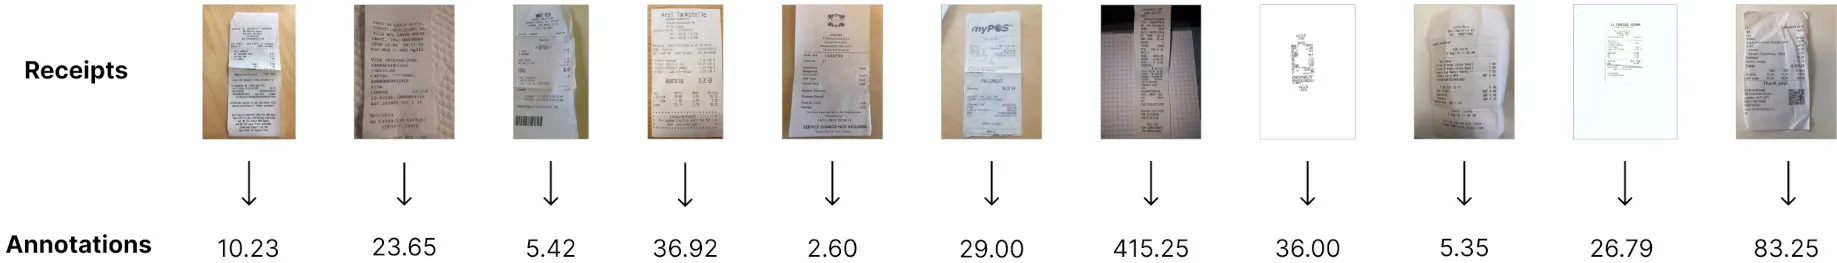
Now you want to know what is the average accuracy (we’ll define the different metrics later: What metrics are important to measure?) of the OCR on those data. This is quite simple, for every data in your data set, you need to run the OCR, and compare the total amount predicted by the receipt OCR with the “ground truth”. The percentage of right predictions of the OCR is the accuracy of the technology on your 11 data.
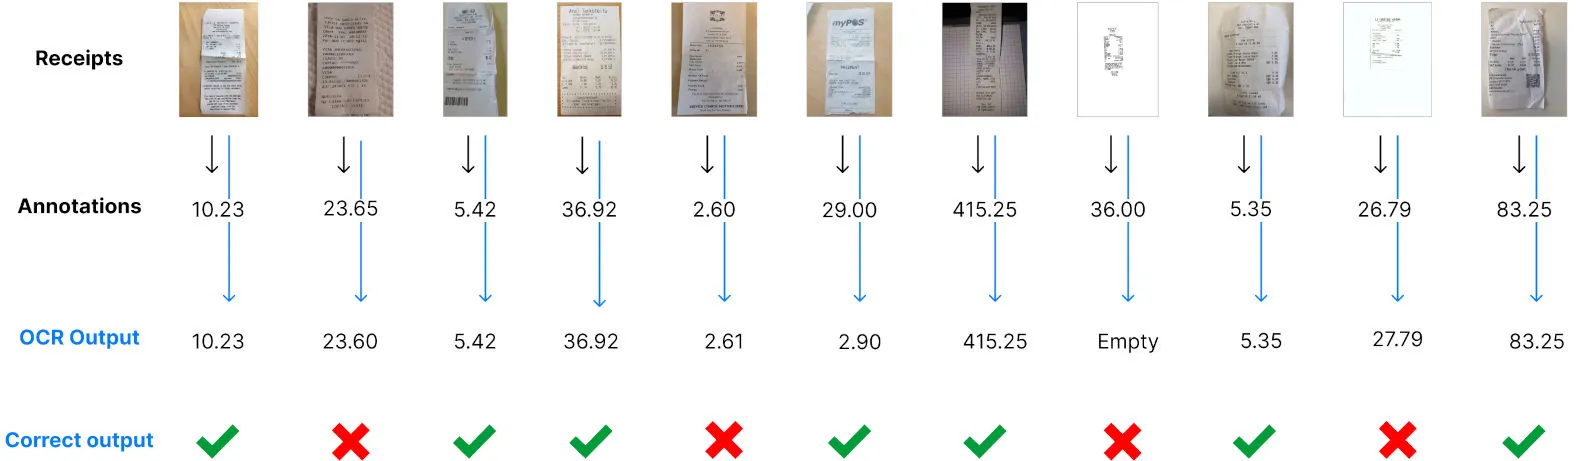
Let’s say that you obtain 64%. Does it mean that if you use at a large scale the OCR, for example with 150.000 receipts a month, you will know for sure that you will get a 64% accuracy as well? Of course not, and we need to understand how accurate is our measure.
Estimating the accuracy of the measure
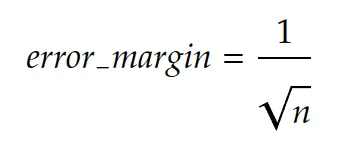
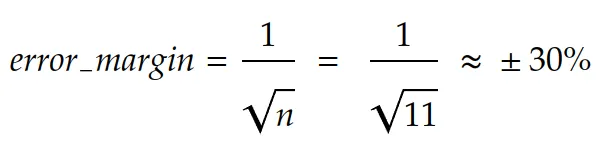
Statistics give us a way to know the error margin with a confidence of 95% of your measurement given the number of receipts you tested the OCR on. There is an approximate formula that is very simple:
In our example, we had 11 data in our test set. The error margin is then 30%:
In other words, it’s very unlikely that you get 64% of accuracy on a large scale. In fact, the real information you get using these 11 test data is: The accuracy of the receipt OCR is between 33.9% and 94.1% with a confidence of 95%.
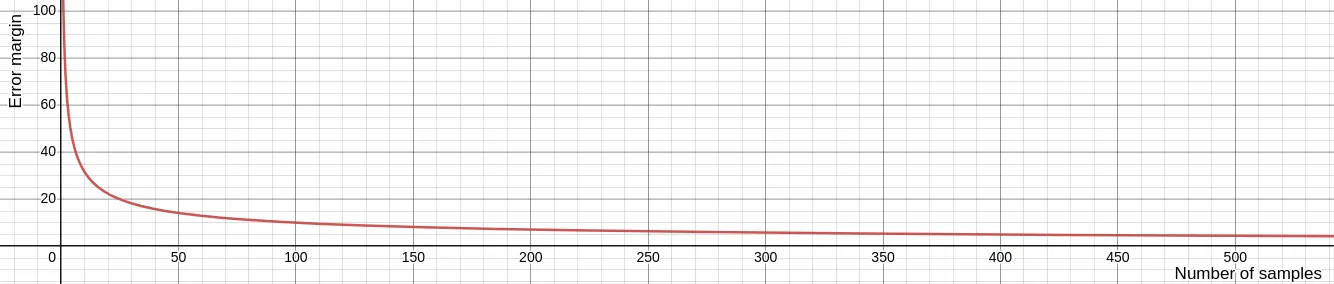
That’s actually why the rule of thumb is “the more data, the more accurate the results are”, because the error margin decrease with the volume of data you test your OCR with, and coverage to an acceptable rate from 1.000 data in your test set. This is how the error margin evolves while increasing the number of test data:
To summarize:
- We suggest having at least 1.000 data in your test set in order to get an accuracy evaluation ~3% close to reality.
- If you don’t have this amount of data, take care of calculating the error of measure to try and draw conclusions taking this approximation into account.
But this is not done yet. It’s not enough to take 1.000 receipts to get an acceptable estimation of the accuracy of the OCR. This formula works under one very important constraint: The data used for measuring the performances must fit the same distribution as your real flow of receipts. In other words, you should select data that represents well the data you will use the OCR on a large scale.
How to select the receipts to use for testing the OCR?
Again, this is a complicated problem, but solutions exist. As we have seen in the last section, in order to understand how accurate our measure is, we can compute the error margin, but this works only if the test set corresponds to data within your real receipts distribution. If you don’t do that, the error margin formula is just not valid anymore, and you can’t make any conclusion about your measure.
To illustrate this problem, let’s assume that you have 98% of US restaurant receipts and 2% of German parking receipts in your real flow of receipts. Does it make sense to test the receipt OCR using 50% of Italian hotel receipts and 50% of Canadian Restaurant receipts? It does not, and the problem is the data distribution. You are not testing the solution in the same conditions as your real flow and thus, the accuracy measurement will be extremely inaccurate.
Statistically speaking, the definition of data distribution in the context of images such as receipts is not obvious. Images are very high dimensions data and finding a linear space in which you make sure the distributions fit is tedious. But there are easy ways to select the data that don’t require much science and are pretty intuitive:
Random choice within your real receipts flow
Choosing randomly your test set can be done only if you already are collecting receipts, and if you want to use the OCR on the same flow. For example, if you are building an expense management mobile application and are already collecting receipts from your users, randomly choosing receipts sent to this application works only if you want to integrate your OCR into this application. If you are using the receipts from this application in order to evaluate the OCR for another usage, an Accounts Payable module, for example, you will most likely not fit the distribution and your measurement is biased.
Criteria-based choice within a receipts database
You might have a receipt database, but don’t have a production flow yet. Because you are not storing your user’s receipts, or because you haven’t launched your app yet. In that case, you can define criteria on the receipts and anticipate your future flow. If you are launching a US-based expense management software, targeting traveling salespeople in the US, you can anticipate that most of the expenses will be about restaurants, hotels, tolls, and parking. You also know that receipts are going to be issued by US merchants. Those criteria help you focus on testing the OCR on the right type of receipts. But it’s still important to be very careful and keep in mind that it’s not your real flow of data and thus, there is a bias in the performances that will be computed.
Once you have your data set selected, it’s important to keep the images unmodified. You might be tempted to add blur, reduce the quality, or obfuscate some text, but by doing that you are actually changing the distribution of the data and thus adding bias, making your benchmark irrelevant or innacurate. If you found your test set on the internet, or another source that doesn’t ensure the images were not modified, take a look at them and remove them from your test set if they contain artifacts like watermarks or digitally added text.
How to annotate the receipts?
Data annotation is the last crucial step before performing the benchmark. This is a tedious task and setting up your annotations guidelines is very important not to waste time.
Why annotate data?
Computing the extraction performances of the OCR is actually comparing the data extracted by the OCR with the ground truth. We could do a manual process, and send data manually one by one in the OCR using a UI to see if the extraction is well done or not. But this would be a subjective judgment, and it’s very important to stay unbiased and objective during the process.
Data annotation is the last step before running the benchmark and having a CSV file or a spreadsheet with all the real values of each important field for each receipt will allow us to:
- Make sure there is no error in our comparisons between ground truth and OCR extractions
- Measure different metrics
- Identify error patterns
Define the important receipts fields and their formats
First, you need to define exactly what fields you want to test the receipt OCR on, and for each field, design a pattern that can be easily used for comparison, because remember that the idea is to automate the comparison process.
For example, if you want to test the performances of the OCR on the date field, you want to make sure your annotations are easily comparable. If the receipt OCR returns dates in an ISO format (yyyy-mm-dd), it’s important to annotate your data in the same format.
Generally speaking, if you have a doubt, following rules that are close to code formats or ISO formats is a good practice to ensure you don’t introduce confusion in your annotations, and that the format can be always compared to OCR outputs.
In order to make sure you can easily compare the annotations with the OCR outputs, here is a list of commonly used data formats easily usable for main fields:
- Dates: “2022-01-14” - “yyyy-mm-dd” ISO 8601 format
- Currencies: “USD” - ISO 4217 format
- Amounts: “138.44” - no comma separation for thousands, a dot for the decimal separation
- Rates: “0.20” for “20%” - the rate
- Time: “14:32” - “hh:mm” [ISO 8601 format](https://en.wikipedia.org/wiki/ISO_8601#:~:text=As of ISO 8601-1,minute between 00 and 59.)
- Text field like Merchant: “Amazon” - The raw text as written in the document
For fields that are a variable-length list of items, it’s a bit more complicated. Let’s think for example about taxes breakdown. On some receipts, you can have none, one or multiple lines of tax, each of them including a rate, an amount, a base, and a code for instance. The problem is that you might not be able to know how many of such lines will be included in a receipt in advance. Moreover, being able to know what amount is associated with what rate is important.
There are many possibilities for that, one requiring code when we’ll compute the results, the other one not requiring code but a little more tedious.
- If you plan to have a developer coding a script to compute the performances in the end: You can design a pattern that will be easily parsed using code. For example “0.20 / VAT / 21.48 | 0.10 / VAT / 12.48”. Adding the separator “/” between each field, and the separator “|” between each line will make sure the developer can split the annotations using those separators and retrieve the values for each field of each item.
- If you want to use only a spreadsheet for computing the performances, it’s also possible. But it requires adding columns for each field of each item and defining the maximum length of your variable list. Moreover, you need to define a reading order (top to bottom for example) because you will compare cells statically annotated in the end. In our tax example, we could define that there are no more than 4 items per receipt, and add columns with headers tax_rate_1, tax_amount_1, tax_code_1, tax_rate_2 etc…
In our example, we’ll perform the receipt OCR benchmark on the following fields:
- Total paid: “138.44” - no comma separation for thousands, a dot for the decimal separation
- Total tax: “11.14” - no comma separation for thousands, a dot for the decimal separation
- Receipt date: “2022-01-14” - “yyyy-mm-dd” ISO 8601 format
- Issued time: “14:32” - “hh:mm” [ISO 8601 format](https://en.wikipedia.org/wiki/ISO_8601#:~:text=As of ISO 8601-1,minute between 00 and 59.)
- Currency: “USD” - ISO 4217 format
- Merchant: “Amazon” - The raw text as written in the document
- Tax items (we’ll use the spreadsheet-only scenario):
- Tax rate: “0.20” for “20%” - the rate
- Tax amount: “138.44” - no comma separation for thousands, a dot for the decimal separation
- Tax code: “City Tax” - The raw text as written in the document
The different tools for OCR annotation
We have drafted the list of receipt fields we are interested in, and the format for each of them in our annotation plan, the critical but not so funny part starts now.
The value of this part doesn’t actually rely only on getting our annotations done and enabling the benchmark. Seeing examples, and annotating them is actually very helpful to anticipate your future users’ questions, and will make you a pro of your topic. While annotating, you are going to understand your data, find out edge cases and potential problems of definitions, identify patterns, etc… Because of that, as a product manager, doing part of the annotation can be very insightful for the future and give you a very deep understanding of your application.
First, you need to select the right tool to annotate your receipts efficiently. Here are a few options:
Directly using the spreadsheet
Pros: Easy to set up, no code required
Cons: Not optimized for data annotation, complicated to do more than 100 receipts
This is probably the less optimized way for annotating your receipts, but it’s also the easiest to set up. If you have a small data set, this solution can work, if you want to annotate more than 100 receipts, this gets tedious.
Le processus est assez simple : pour chaque fichier de la feuille de calcul, ajoutez une ligne avec le nom du fichier et les champs sur lesquels vous souhaitez calculer votre point de référence dans la colonne de droite.
L'avantage, c'est que vous n'aurez pas à traiter les résultats comme vous pourriez avoir à le faire à l'aide d'un autre outil, car il se trouve déjà dans la feuille de calcul de référence.
Utilisation d'un outil d'annotation open source
Avantages : Processus d'annotation gratuit et optimisé grâce à l'interface utilisateur
Inconvénients : Nécessite des compétences en codage pour configurer l'interface et traiter les résultats
Des outils tels que Github peut être très utile. Une fois que l'outil est configuré sur votre machine et que vous avez compris comment l'utiliser, le processus peut être efficace grâce à son interface utilisateur. Le principal problème est que vous avez besoin de compétences en codage pour le lancer sur votre machine. De plus, les annotations sont présentées dans un format structuré standard mais peuvent ne pas correspondre exactement à un format simple qui peut être saisi dans la feuille de calcul sans codage.
Utiliser un logiciel payant
Avantages : Processus d'annotation optimisé grâce à l'interface utilisateur, format de sortie facile
Inconvénients : Payant et nécessitant parfois une configuration
Cela inclut toutes les fonctionnalités nécessaires pour effectuer un processus d'annotation efficace. Le principal inconvénient est que la plupart de ces produits ciblent les entreprises clientes et sont intéressés par une utilisation à grande échelle. Cela signifie qu'ils sont coûteux et qu'ils ne seront peut-être pas intéressés par votre projet, car vous n'annotez que quelques milliers de données.
Utilisation de Mindee
Nous n'avons trouvé aucun outil d'annotation gratuit et optimisé pour les reçus et les documents. Nous avons alors décidé de développer cet outil pour aider nos clients et nos équipes à annoter efficacement les reçus, les factures ou tout type de document. Il est entièrement gratuit et peut couvrir la plupart des cas d'utilisation de l'annotation de vos documents. Si vous souhaitez y accéder, il vous suffit de vous connecter au chat et nous créerons votre compte.
Quelle que soit la solution que vous avez décidé d'utiliser, le résultat final de cette phase est de rassembler les annotations dans un format utilisable pour votre outil de référence. Dans notre exemple utilisant la feuille de calcul, vous devez voir une ligne pour chaque fichier, ainsi que les champs annotés pour chacun d'entre eux. Assurez-vous de valider votre fichier la dernière fois pour vous assurer que vous n'avez pas mélangé les noms de fichiers avec les annotations, par exemple, et nous sommes prêts à passer à l'étape suivante.
Exécution du benchmark OCR des reçus
Maintenant que vos reçus sont annotés, nous devons comparer les résultats de l'OCR des reçus à vos annotations. Pour ce faire, nous allons définir quelques indicateurs qui peuvent être pertinents pour votre cas d'utilisation, ainsi que leur valeur commerciale.
Cliquez ci-dessous pour télécharger l'outil de référence OCR gratuit de Mindee et commencer votre évaluation dès aujourd'hui !
Téléchargez l'outil de référence OCR gratuit
Quels indicateurs utiliser ?
L'extraction de données à partir de reçus à l'aide d'une OCR n'est pas une fin en soi. Certains cas d'utilisation de l'OCR peuvent être par exemple :
- Remplissez automatiquement un formulaire qui sera validé par vos utilisateurs, sans avoir à récupérer eux-mêmes toutes les informations sur les reçus bruts.
- Automatisez entièrement un processus qui nécessite des données provenant d'images de reçus sans aucune intervention humaine.
- Collectez des données à partir d'une base de données de reçus afin d'extraire des informations sur les types d'achats.
Selon le cas d'utilisation, les mesures à calculer peuvent différer car leur valeur commerciale est différente. Nous essaierons de définir quelques indicateurs importants et d'expliquer comment ils peuvent être transcrits en valeur commerciale dans les sections suivantes.
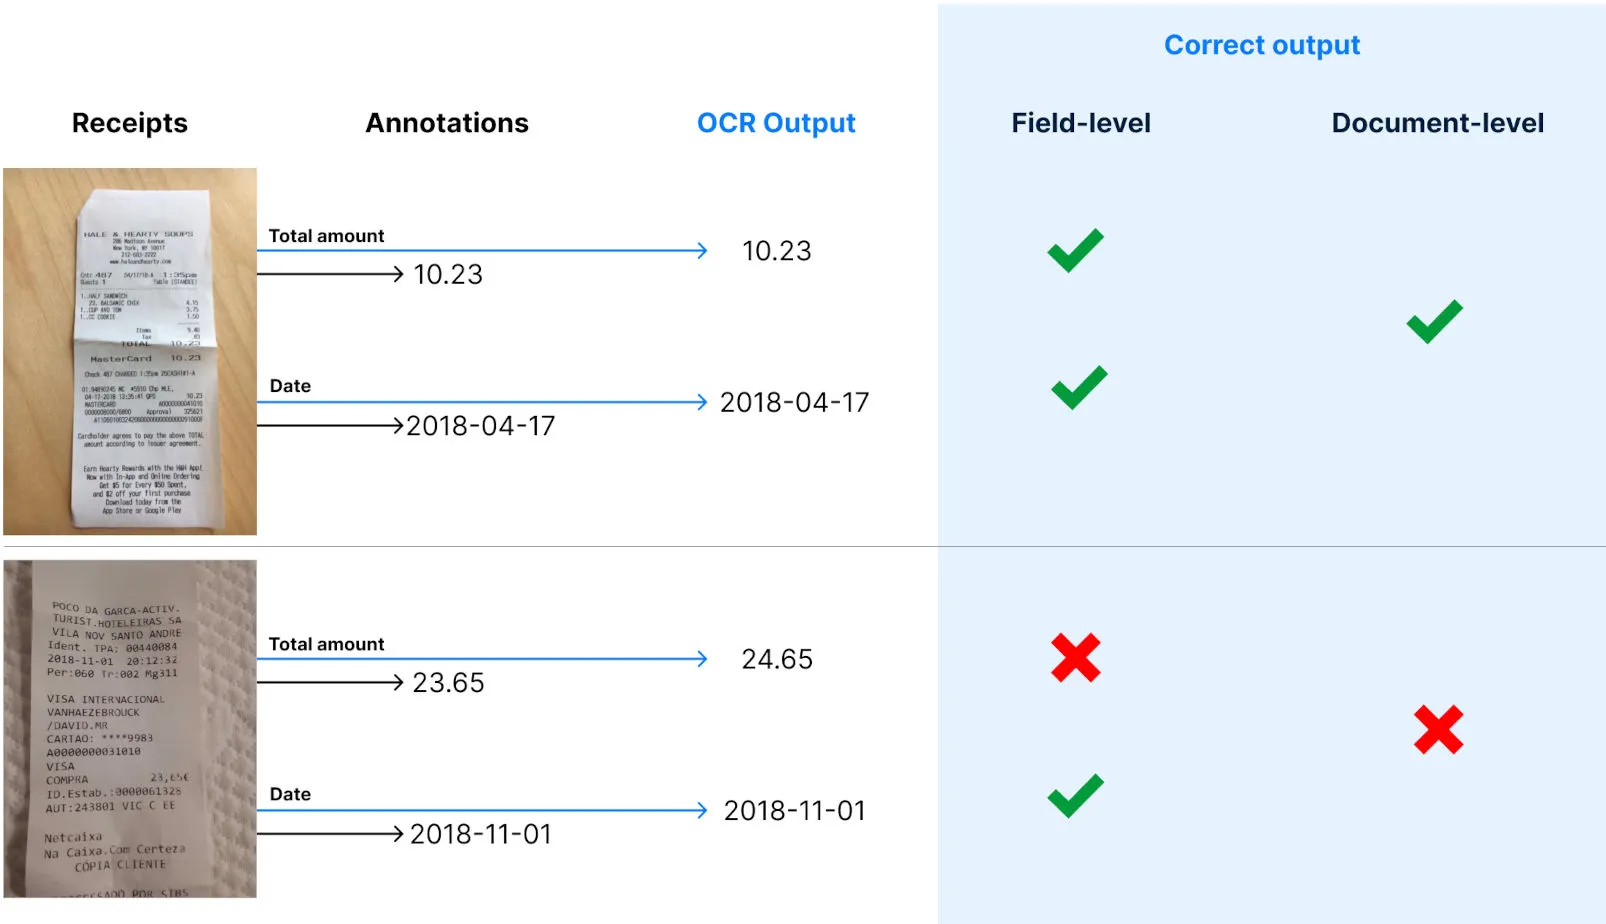
Métriques au niveau du document et au niveau du terrain
Avant de passer aux métriques, définissons deux étendues importantes à prendre en compte pour calculer les métriques. L'objectif est de faire la distinction entre une réponse correcte pour le reçu complet ou pour un champ du reçu.
Le niveau du document fait référence à une sortie correcte pour l'ensemble du document, ce qui signifie que toutes les sorties de chaque champ sont correctes.
Le niveau du champ est plus granulaire et correspond à un champ unique dans un document correctement généré par l'OCR.
Exactitude
La précision est probablement la métrique la plus couramment utilisée en statistique pour calculer les performances des algorithmes. C'est aussi le plus facile à comprendre. Il s'agit simplement du pourcentage de bonnes prédictions (sorties OCR) sur un ensemble de données.
Exemple : Vous disposez d'un kit de test contenant 1 000 reçus qui correspondent à votre distribution de données réelle, et vous essayez de calculer la précision du reçu OCR dans le champ Montant total. Si l'OCR a produit 861 bonnes réponses sur 1 000 reçus, la précision est de 86,1 %. 1 000 données pour les tests correspondent à une marge d'erreur de 3,2 %. Vous pouvez conclure qu'avec une confiance de 95 %, la précision de l'OCR sur la quantité totale d'extraction se situera entre 82,9 % et 89,3 %.
Qu'est-ce que cela signifie dans votre cas d'utilisation ?
Au niveau du terrain, nous considérons que la sortie OCR est correcte si elle est égale au champ annoté.
- Si votre cas d'utilisation est le pré-remplissage d'un formulaire qui sera validé par un utilisateur, il s'agit du nombre moyen de corrections que vos utilisateurs devront effectuer dans ce champ afin d'obtenir des données précises. En d'autres termes, si vous pensez que la correction d'un champ prend 12 secondes, vous pouvez ajouter une valeur temporelle en plus de la précision au niveau du champ pour chaque champ.
- Si votre cas d'utilisation est une tâche d'automatisation complète sans intervention humaine, la précision au niveau des champs peut vous aider à déterminer quels champs constituent les obstacles à l'amélioration de la précision au niveau du document et à prendre des mesures à cet égard pour optimiser les résultats. Par exemple, si votre flux nécessite l'automatisation de l'extraction de la date et du montant total, et que vous avez une précision au niveau des champs de 74 % et 94 %, vous savez que la précision au niveau du document et donc votre taux d'automatisation ne peuvent pas être supérieurs à 74 %.
Au niveau du document, nous considérons que la sortie OCR est correcte si tous les champs qui vous intéressent sont corrects au niveau du champ. La précision, dans ce cas, correspond à la proportion de reçus qui seront extraits correctement.
- Si votre cas d'utilisation consiste à pré-remplir un formulaire qui sera validé par un utilisateur, il s'agit de la proportion de reçus sur lesquels vos utilisateurs n'auront rien à corriger. En d'autres termes, le reste des reçus nécessitera une action de la part de votre utilisateur pour corriger l'extraction.
- Si votre cas d'utilisation est une tâche d'automatisation complète sans intervention humaine, la précision au niveau du document correspond tout simplement au taux d'automatisation correct. Les sorties contenant une erreur (précision de 100 % au niveau du document) sont très dangereuses car elles contiennent toutes une erreur et peuvent donc entraîner une automatisation basée sur des données erronées. Afin de s'assurer que le taux d'automatisation correct est élevé, la précision est une meilleure métrique.
Précision
Exactitude et précision sont deux mots qui prêtent à confusion et qui n'ont pas du tout le même sens en statistique. Alors que la précision est un indicateur permettant de répondre à la question « Quel est le pourcentage de bonnes réponses ? » , Precision répond à la question « Lorsque l'OCR produit quelque chose, quel est le pourcentage de sorties correctes ? ». Cela ressemble beaucoup à la précision, et c'est en effet corrélé à celle-ci. Mais comme nous allons le voir, cela n'a pas la même signification.
Pour calculer la précision, vous devez calculer la proportion de bonnes réponses, mais pas sur l'ensemble de votre ensemble de données, mais uniquement sur le sous-échantillon de celui-ci sur lequel l'OCR a produit une valeur non nulle.
Exemple : Vous avez 1000 données dans votre ensemble de test et vous essayez de calculer la précision de l'OCR sur la quantité totale du champ. L'OCR a généré une valeur pour le montant total sur 914 reçus et a renvoyé un nul valeur pour les autres. Parmi ces 914 reçus, le montant total a été correctement extrait pour 861 d'entre eux. Votre précision est alors de 861/914 = 94,2 %. La marge d'erreur est de 3,2 % avec 1 000 données. Vous pouvez alors conclure qu'avec une confiance de 95 %, la précision de l'OCR sur le montant total du champ se situe entre 91 % et 97,4 %.
Comme vous pouvez le constater, précision et exactitude sont similaires mais très différentes. Il est possible d'avoir une précision de 100 %, avec une précision de 0,1 %.
Dans vos cas d'utilisation, la précision peut être révélatrice :
Au niveau du terrain
- Si votre cas d'utilisation est le pré-remplissage d'un formulaire qui sera validé par un utilisateur, la précision correspond au nombre de fois qu'il y aura une saisie automatique pour ce champ, et la saisie automatique est correcte. Si l'OCR est très précise, l'utilisateur ne pourra pas faire d'erreur car le champ ne sera pas du tout rempli en cas d'erreur et l'utilisateur ne pourra pas l'ignorer. De plus, il est plus facile de corriger un champ vide que de corriger un champ qui contient déjà quelque chose. Une précision plus élevée au niveau du champ a également une valeur temporelle car la correction d'un champ est plus rapide.
- Si votre cas d'utilisation est une tâche d'automatisation complète sans intervention humaine, la précision au niveau des champs ne fournit pas beaucoup d'informations, mais tout comme la précision au niveau des champs, elle peut donner un aperçu des champs qui constituent les goulots d'étranglement de la métrique au niveau du document.
Au niveau du document
- Si votre cas d'utilisation consiste à pré-remplir un formulaire qui sera validé par un utilisateur, la précision au niveau du document n'est pas très révélatrice. Cela correspond au pourcentage de reçus sur lesquels les utilisateurs devront remplir les champs du formulaire uniquement lorsqu'ils sont vides, et n'auront donc pas à corriger les champs complétés automatiquement. Mais vous pouvez mesurer le temps nécessaire pour les deux cas, et il peut encore y avoir un temps intéressant à économiser pour corriger les champs vides par rapport aux champs mal remplis automatiquement.
- Si votre cas d'utilisation est une tâche d'automatisation complète sans intervention humaine, la précision au niveau du document est essentielle. Dans ces cas d'utilisation, nous préférons que l'OCR ne génère rien plutôt que lorsqu'elle renvoie une réponse incorrecte, car tout est automatisé et le processus se poursuivra avec des données erronées. Pour cette raison, la précision n'est pas très importante, car vous allez très probablement rejeter une prédiction contenant une valeur nulle car vous savez à l'avance que vous ne disposez pas de tous les champs obligatoires, ce qui entraînerait une erreur. Étant donné que l'étape suivante de votre processus automatisé peut être très dangereuse en cas de données erronées, la précision au niveau du document vous donne le pourcentage de données erronées qui seront utilisées dans le flux automatisé. Prenons l'exemple d'un cas d'utilisation de l'automatisation des comptes fournisseurs. Vous regroupez les factures dans votre application et vous essayez d'automatiser complètement leur paiement. Une précision de 91 % au niveau des documents signifie que vos clients paieront, dans 9 % des cas, un montant qui n'est pas le bon montant de la facture. C'est évidemment impossible, et il est crucial de se rapprocher le plus possible des 100 %.
Conclusion
Voici un résumé des meilleures pratiques à prendre en compte lorsque vous testerez une technologie d'OCR de reçus :
À propos des données
- 1 000 données de votre ensemble de test vous donneront une approximation fiable de 95 % de la précision avec une marge d'erreur de 3 %. Si vous n'avez pas 1 000 reçus, calculez la formule de marge d'erreur pour déterminer la précision de votre point de référence.
- Sélectionnez les données qui correspondent à votre problème réel. Si vous n'avez pas encore de flux de production, ou s'il est difficile de le faire automatiquement, essayez d'extraire des modèles dans vos données qui vous aideront à créer le kit de test (par exemple : pays, devises, type de dépenses, dates, etc.)
- Effectuez au moins deux séries d'annotations de données avant de mesurer les performances, car les impacts d'annotations erronées peuvent être très importants.
À propos
.svg)
.webp)
.webp)

.webp)