
.svg)
.svg)



Tabla de Contenidos
When choosing a document data extraction solution, being able to perform an insightful and unbiased benchmark among different providers is important before drawing conclusions. Depending on the type of solutions you are testing, or the problem you are trying to solve, the process might differ because there is no generic and absolute benchmark strategy. Most receipt Optical Character Recognition (OCR) technologies rely on statistical approaches (like machine learning or deep learning), and performing benchmarks on those technologies must follow some important guidelines in order to get meaningful and unbiased insights leading to a decision. How does a receipt OCR work?
Click below to download Mindee's free OCR benchmark tool and start your evaluation today!
Download the Free OCR Benchmark Tool
How does a receipt OCR work?
Receipt OCR technologies extract data from images of expense receipts in a machine-encoded format that can be used in software applications. They are mainly used to automatically extract data from receipts in order to optimize or automate a manual process. Depending on the technology, the list of extracted fields can differ, but the main data points usually extracted are the amounts, taxes, date and time, and supplier information.
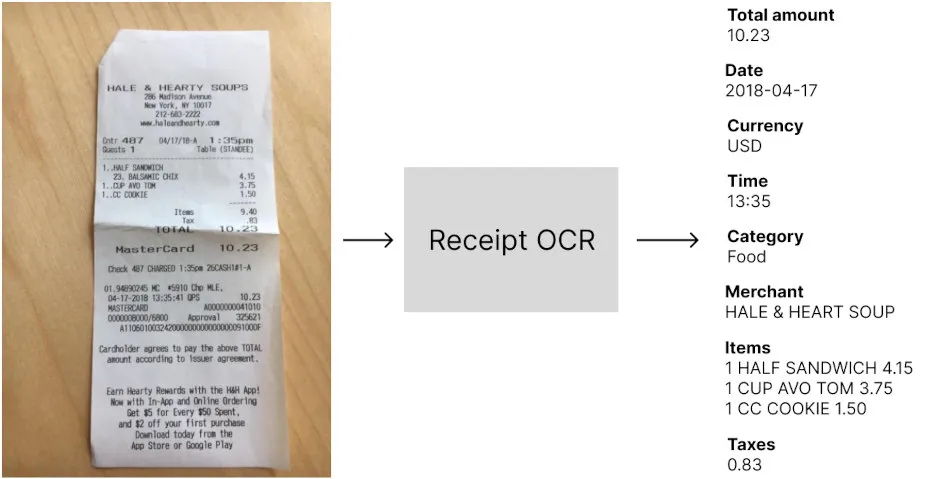
Evaluating a receipt OCR has many aspects, like the set of extracted fields, the pricing, and the extra features. We’ll focus in this article on the most important part of the benchmark that can help you understand how well it will perform in your applications, the technical performances:
- Extraction performances: the goal is to measure the impact of the technology on the optimization of the manual data entry process. By testing the OCR, you want to understand how many times the OCR outputs the right answer for the total amount, the date, etc… In other words, you want to specify performance metrics like accuracy, automation rate, precision, or any other relvant metric that matches your business goal.
- Speed: most expense management solutions offer real-time user experiences and it’s important to make sure that users will not wait before the receipt data are extracted. This benchmark should help you understand how long your users would wait before the data is extracted.
But because most receipt OCRs are built using statistical approaches that don’t behave the same way depending on the data, it’s very important to choose carefully the set of receipts used for evaluation.
Create a meaningful set of receipts for testing the OCR
This is definitely the most important part of the process because depending on the dataset you send to the OCR you might have different results and you want to make sure you are testing the solution on the same scope as your usage. And worse, if your data set is too small, you can get a measure of the accuracy that is not even close to the real accuracy you will see in production.
In other words, when performing your benchmark, you want to get an accurate and unbiased estimation of the performances of the OCR if you were to use it on your real-world use case.
“It's easy to lie with statistics, but it's hard to tell the truth without them.”
― Charles Wheelan Naked Statistics: Stripping the Dread from the Data
How many receipts to use in order to get an accurate estimation of the performances?
The problem of not having enough data in your test set
The rule of thumb is “the more data, the more accurate the benchmark is”, but that’s not really actionable. This is actually a very difficult question! But statistics offer an easy way to think about this question differently.
First, let’s think about a simple problem. You have 11 receipts in your data set, and for each of those receipts, you have the corresponding total amount that you’ve written in a spreadsheet (We’ll talk about this later: Annotating the receipt data set). An illustration of your data is something like this:

Now you want to know what is the average accuracy (we’ll define the different metrics later: What metrics are important to measure?) of the OCR on those data. This is quite simple, for every data in your data set, you need to run the OCR, and compare the total amount predicted by the receipt OCR with the “ground truth”. The percentage of right predictions of the OCR is the accuracy of the technology on your 11 data.
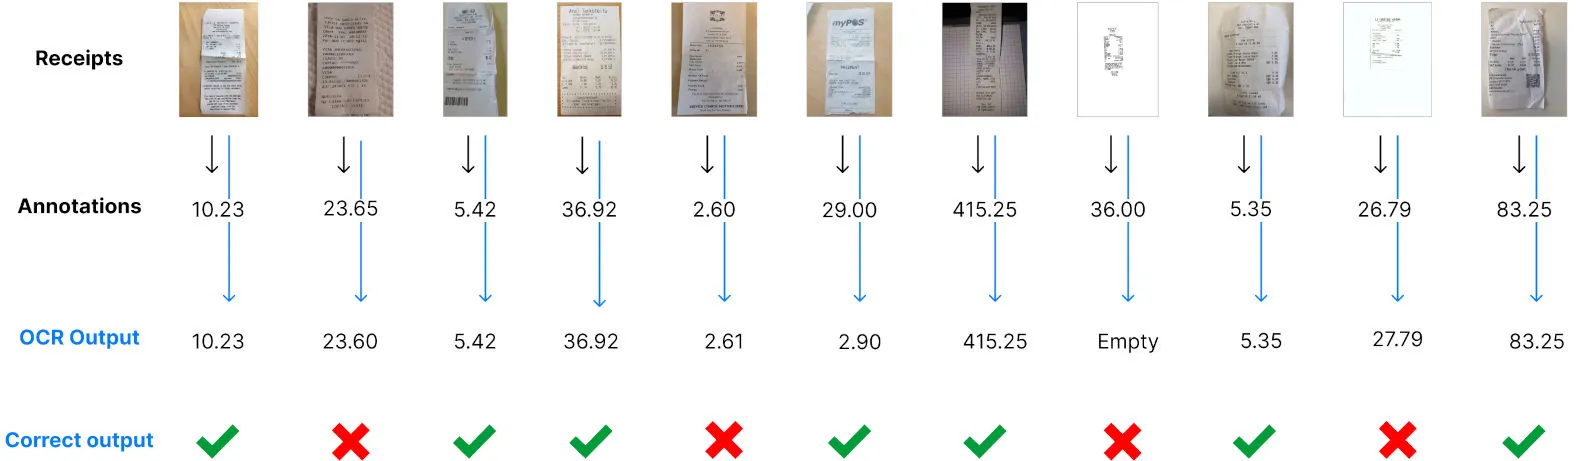
Let’s say that you obtain 64%. Does it mean that if you use at a large scale the OCR, for example with 150.000 receipts a month, you will know for sure that you will get a 64% accuracy as well? Of course not, and we need to understand how accurate is our measure.
Estimating the accuracy of the measure
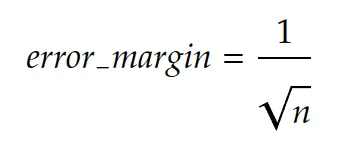
Statistics give us a way to know the error margin with a confidence of 95% of your measurement given the number of receipts you tested the OCR on. There is an approximate formula that is very simple:
In our example, we had 11 data in our test set. The error margin is then 30%:
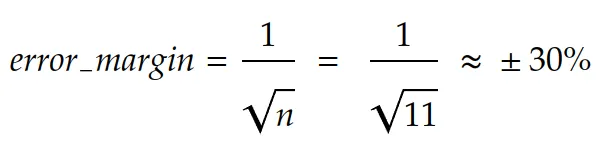
In other words, it’s very unlikely that you get 64% of accuracy on a large scale. In fact, the real information you get using these 11 test data is: The accuracy of the receipt OCR is between 33.9% and 94.1% with a confidence of 95%.
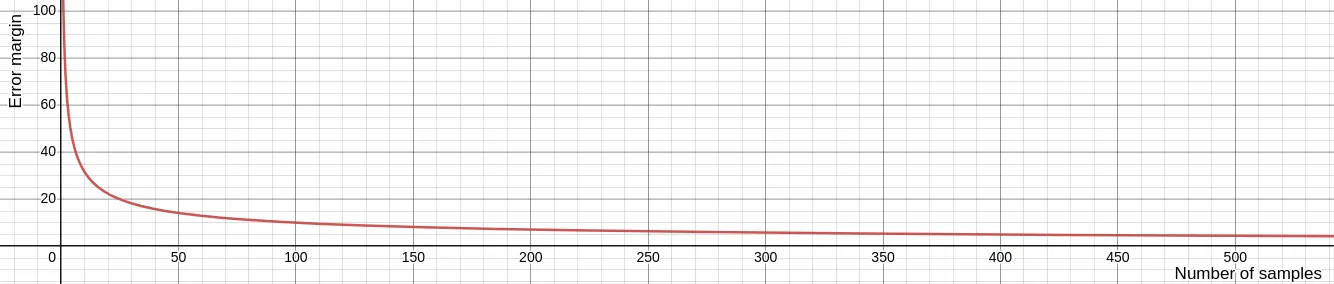
That’s actually why the rule of thumb is “the more data, the more accurate the results are”, because the error margin decrease with the volume of data you test your OCR with, and coverage to an acceptable rate from 1.000 data in your test set. This is how the error margin evolves while increasing the number of test data:
To summarize:
- We suggest having at least 1.000 data in your test set in order to get an accuracy evaluation ~3% close to reality.
- If you don’t have this amount of data, take care of calculating the error of measure to try and draw conclusions taking this approximation into account.
But this is not done yet. It’s not enough to take 1.000 receipts to get an acceptable estimation of the accuracy of the OCR. This formula works under one very important constraint: The data used for measuring the performances must fit the same distribution as your real flow of receipts. In other words, you should select data that represents well the data you will use the OCR on a large scale.
How to select the receipts to use for testing the OCR?
Again, this is a complicated problem, but solutions exist. As we have seen in the last section, in order to understand how accurate our measure is, we can compute the error margin, but this works only if the test set corresponds to data within your real receipts distribution. If you don’t do that, the error margin formula is just not valid anymore, and you can’t make any conclusion about your measure.
To illustrate this problem, let’s assume that you have 98% of US restaurant receipts and 2% of German parking receipts in your real flow of receipts. Does it make sense to test the receipt OCR using 50% of Italian hotel receipts and 50% of Canadian Restaurant receipts? It does not, and the problem is the data distribution. You are not testing the solution in the same conditions as your real flow and thus, the accuracy measurement will be extremely inaccurate.
Statistically speaking, the definition of data distribution in the context of images such as receipts is not obvious. Images are very high dimensions data and finding a linear space in which you make sure the distributions fit is tedious. But there are easy ways to select the data that don’t require much science and are pretty intuitive:
Random choice within your real receipts flow
Choosing randomly your test set can be done only if you already are collecting receipts, and if you want to use the OCR on the same flow. For example, if you are building an expense management mobile application and are already collecting receipts from your users, randomly choosing receipts sent to this application works only if you want to integrate your OCR into this application. If you are using the receipts from this application in order to evaluate the OCR for another usage, an Accounts Payable module, for example, you will most likely not fit the distribution and your measurement is biased.
Criteria-based choice within a receipts database
You might have a receipt database, but don’t have a production flow yet. Because you are not storing your user’s receipts, or because you haven’t launched your app yet. In that case, you can define criteria on the receipts and anticipate your future flow. If you are launching a US-based expense management software, targeting traveling salespeople in the US, you can anticipate that most of the expenses will be about restaurants, hotels, tolls, and parking. You also know that receipts are going to be issued by US merchants. Those criteria help you focus on testing the OCR on the right type of receipts. But it’s still important to be very careful and keep in mind that it’s not your real flow of data and thus, there is a bias in the performances that will be computed.
Once you have your data set selected, it’s important to keep the images unmodified. You might be tempted to add blur, reduce the quality, or obfuscate some text, but by doing that you are actually changing the distribution of the data and thus adding bias, making your benchmark irrelevant or innacurate. If you found your test set on the internet, or another source that doesn’t ensure the images were not modified, take a look at them and remove them from your test set if they contain artifacts like watermarks or digitally added text.
How to annotate the receipts?
Data annotation is the last crucial step before performing the benchmark. This is a tedious task and setting up your annotations guidelines is very important not to waste time.
Why annotate data?
Computing the extraction performances of the OCR is actually comparing the data extracted by the OCR with the ground truth. We could do a manual process, and send data manually one by one in the OCR using a UI to see if the extraction is well done or not. But this would be a subjective judgment, and it’s very important to stay unbiased and objective during the process.
Data annotation is the last step before running the benchmark and having a CSV file or a spreadsheet with all the real values of each important field for each receipt will allow us to:
- Make sure there is no error in our comparisons between ground truth and OCR extractions
- Measure different metrics
- Identify error patterns
Define the important receipts fields and their formats
First, you need to define exactly what fields you want to test the receipt OCR on, and for each field, design a pattern that can be easily used for comparison, because remember that the idea is to automate the comparison process.
For example, if you want to test the performances of the OCR on the date field, you want to make sure your annotations are easily comparable. If the receipt OCR returns dates in an ISO format (yyyy-mm-dd), it’s important to annotate your data in the same format.
Generally speaking, if you have a doubt, following rules that are close to code formats or ISO formats is a good practice to ensure you don’t introduce confusion in your annotations, and that the format can be always compared to OCR outputs.
In order to make sure you can easily compare the annotations with the OCR outputs, here is a list of commonly used data formats easily usable for main fields:
- Dates: “2022-01-14” - “yyyy-mm-dd” ISO 8601 format
- Currencies: “USD” - ISO 4217 format
- Amounts: “138.44” - no comma separation for thousands, a dot for the decimal separation
- Rates: “0.20” for “20%” - the rate
- Time: “14:32” - “hh:mm” [ISO 8601 format](https://en.wikipedia.org/wiki/ISO_8601#:~:text=As of ISO 8601-1,minute between 00 and 59.)
- Text field like Merchant: “Amazon” - The raw text as written in the document
For fields that are a variable-length list of items, it’s a bit more complicated. Let’s think for example about taxes breakdown. On some receipts, you can have none, one or multiple lines of tax, each of them including a rate, an amount, a base, and a code for instance. The problem is that you might not be able to know how many of such lines will be included in a receipt in advance. Moreover, being able to know what amount is associated with what rate is important.
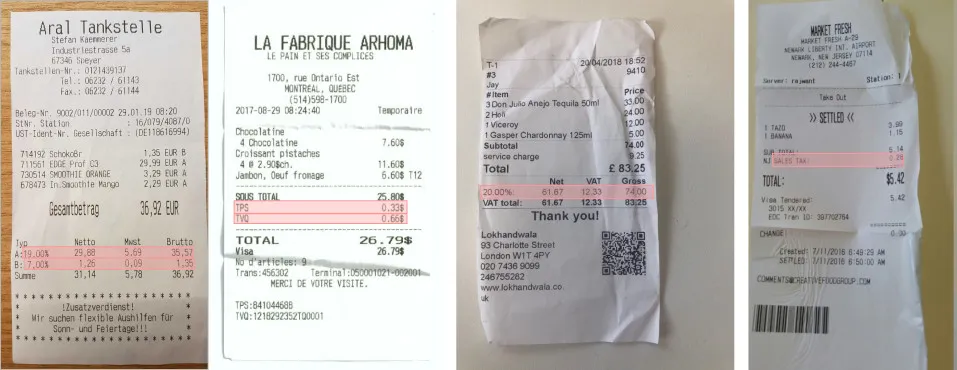
There are many possibilities for that, one requiring code when we’ll compute the results, the other one not requiring code but a little more tedious.
- If you plan to have a developer coding a script to compute the performances in the end: You can design a pattern that will be easily parsed using code. For example “0.20 / VAT / 21.48 | 0.10 / VAT / 12.48”. Adding the separator “/” between each field, and the separator “|” between each line will make sure the developer can split the annotations using those separators and retrieve the values for each field of each item.
- If you want to use only a spreadsheet for computing the performances, it’s also possible. But it requires adding columns for each field of each item and defining the maximum length of your variable list. Moreover, you need to define a reading order (top to bottom for example) because you will compare cells statically annotated in the end. In our tax example, we could define that there are no more than 4 items per receipt, and add columns with headers tax_rate_1, tax_amount_1, tax_code_1, tax_rate_2 etc…
In our example, we’ll perform the receipt OCR benchmark on the following fields:
- Total paid: “138.44” - no comma separation for thousands, a dot for the decimal separation
- Total tax: “11.14” - no comma separation for thousands, a dot for the decimal separation
- Receipt date: “2022-01-14” - “yyyy-mm-dd” ISO 8601 format
- Issued time: “14:32” - “hh:mm” [ISO 8601 format](https://en.wikipedia.org/wiki/ISO_8601#:~:text=As of ISO 8601-1,minute between 00 and 59.)
- Currency: “USD” - ISO 4217 format
- Merchant: “Amazon” - The raw text as written in the document
- Tax items (we’ll use the spreadsheet-only scenario):
- Tax rate: “0.20” for “20%” - the rate
- Tax amount: “138.44” - no comma separation for thousands, a dot for the decimal separation
- Tax code: “City Tax” - The raw text as written in the document
The different tools for OCR annotation
We have drafted the list of receipt fields we are interested in, and the format for each of them in our annotation plan, the critical but not so funny part starts now.
The value of this part doesn’t actually rely only on getting our annotations done and enabling the benchmark. Seeing examples, and annotating them is actually very helpful to anticipate your future users’ questions, and will make you a pro of your topic. While annotating, you are going to understand your data, find out edge cases and potential problems of definitions, identify patterns, etc… Because of that, as a product manager, doing part of the annotation can be very insightful for the future and give you a very deep understanding of your application.
First, you need to select the right tool to annotate your receipts efficiently. Here are a few options:
Directly using the spreadsheet
Pros: Easy to set up, no code required
Cons: Not optimized for data annotation, complicated to do more than 100 receipts
This is probably the less optimized way for annotating your receipts, but it’s also the easiest to set up. If you have a small data set, this solution can work, if you want to annotate more than 100 receipts, this gets tedious.
El proceso es bastante sencillo: para cada archivo en la hoja de cálculo, añade una línea con el nombre del archivo y los campos sobre los que quieres calcular tu benchmark en la columna de la derecha.
Lo bueno de esto es que no tendrás que procesar los resultados, como quizás tendrías que hacer con otra herramienta, porque ya están en la hoja de cálculo del benchmark.
Uso de una herramienta de anotación de código abierto
Ventajas: Gratuita, Proceso de anotación optimizado gracias a la interfaz de usuario
Desventajas: Requiere conocimientos de programación para configurar la interfaz y procesar los resultados
Herramientas como Github pueden ser muy útiles. Una vez que la herramienta está configurada en tu máquina y has entendido cómo usarla, el proceso puede ser eficiente gracias a su interfaz de usuario. El principal problema es que necesitas algunos conocimientos de programación para ejecutarla en tu máquina. Además, las anotaciones vienen en un formato estructurado estándar, pero puede que no se ajusten exactamente a un formato sencillo que pueda introducirse en la hoja de cálculo sin programar.
Uso de un software de pago
Ventajas: Proceso de anotación optimizado gracias a la interfaz de usuario, formato de salida sencillo
Desventajas: De pago, y a veces requiere configuración
Esto incluye todas las características necesarias para un proceso de anotación eficiente. El principal inconveniente es que la mayoría de estos productos están dirigidos a clientes empresariales y están interesados en un uso a gran escala. Esto significa que son caros y puede que no estén interesados en tu proyecto, ya que solo estás anotando unos pocos miles de datos.
Uso de Mindee
No pudimos encontrar ninguna herramienta de anotación gratuita y optimizada para recibos y documentos. Decidimos entonces desarrollar esta herramienta para ayudar a nuestros clientes y equipos a ser eficientes en la anotación de recibos, facturas o cualquier tipo de documento. Es completamente gratuita y puede cubrir la mayoría de tus casos de uso de anotación de documentos. Si quieres acceder a ella, simplemente ponte en contacto con nosotros a través del chat y configuraremos tu cuenta.
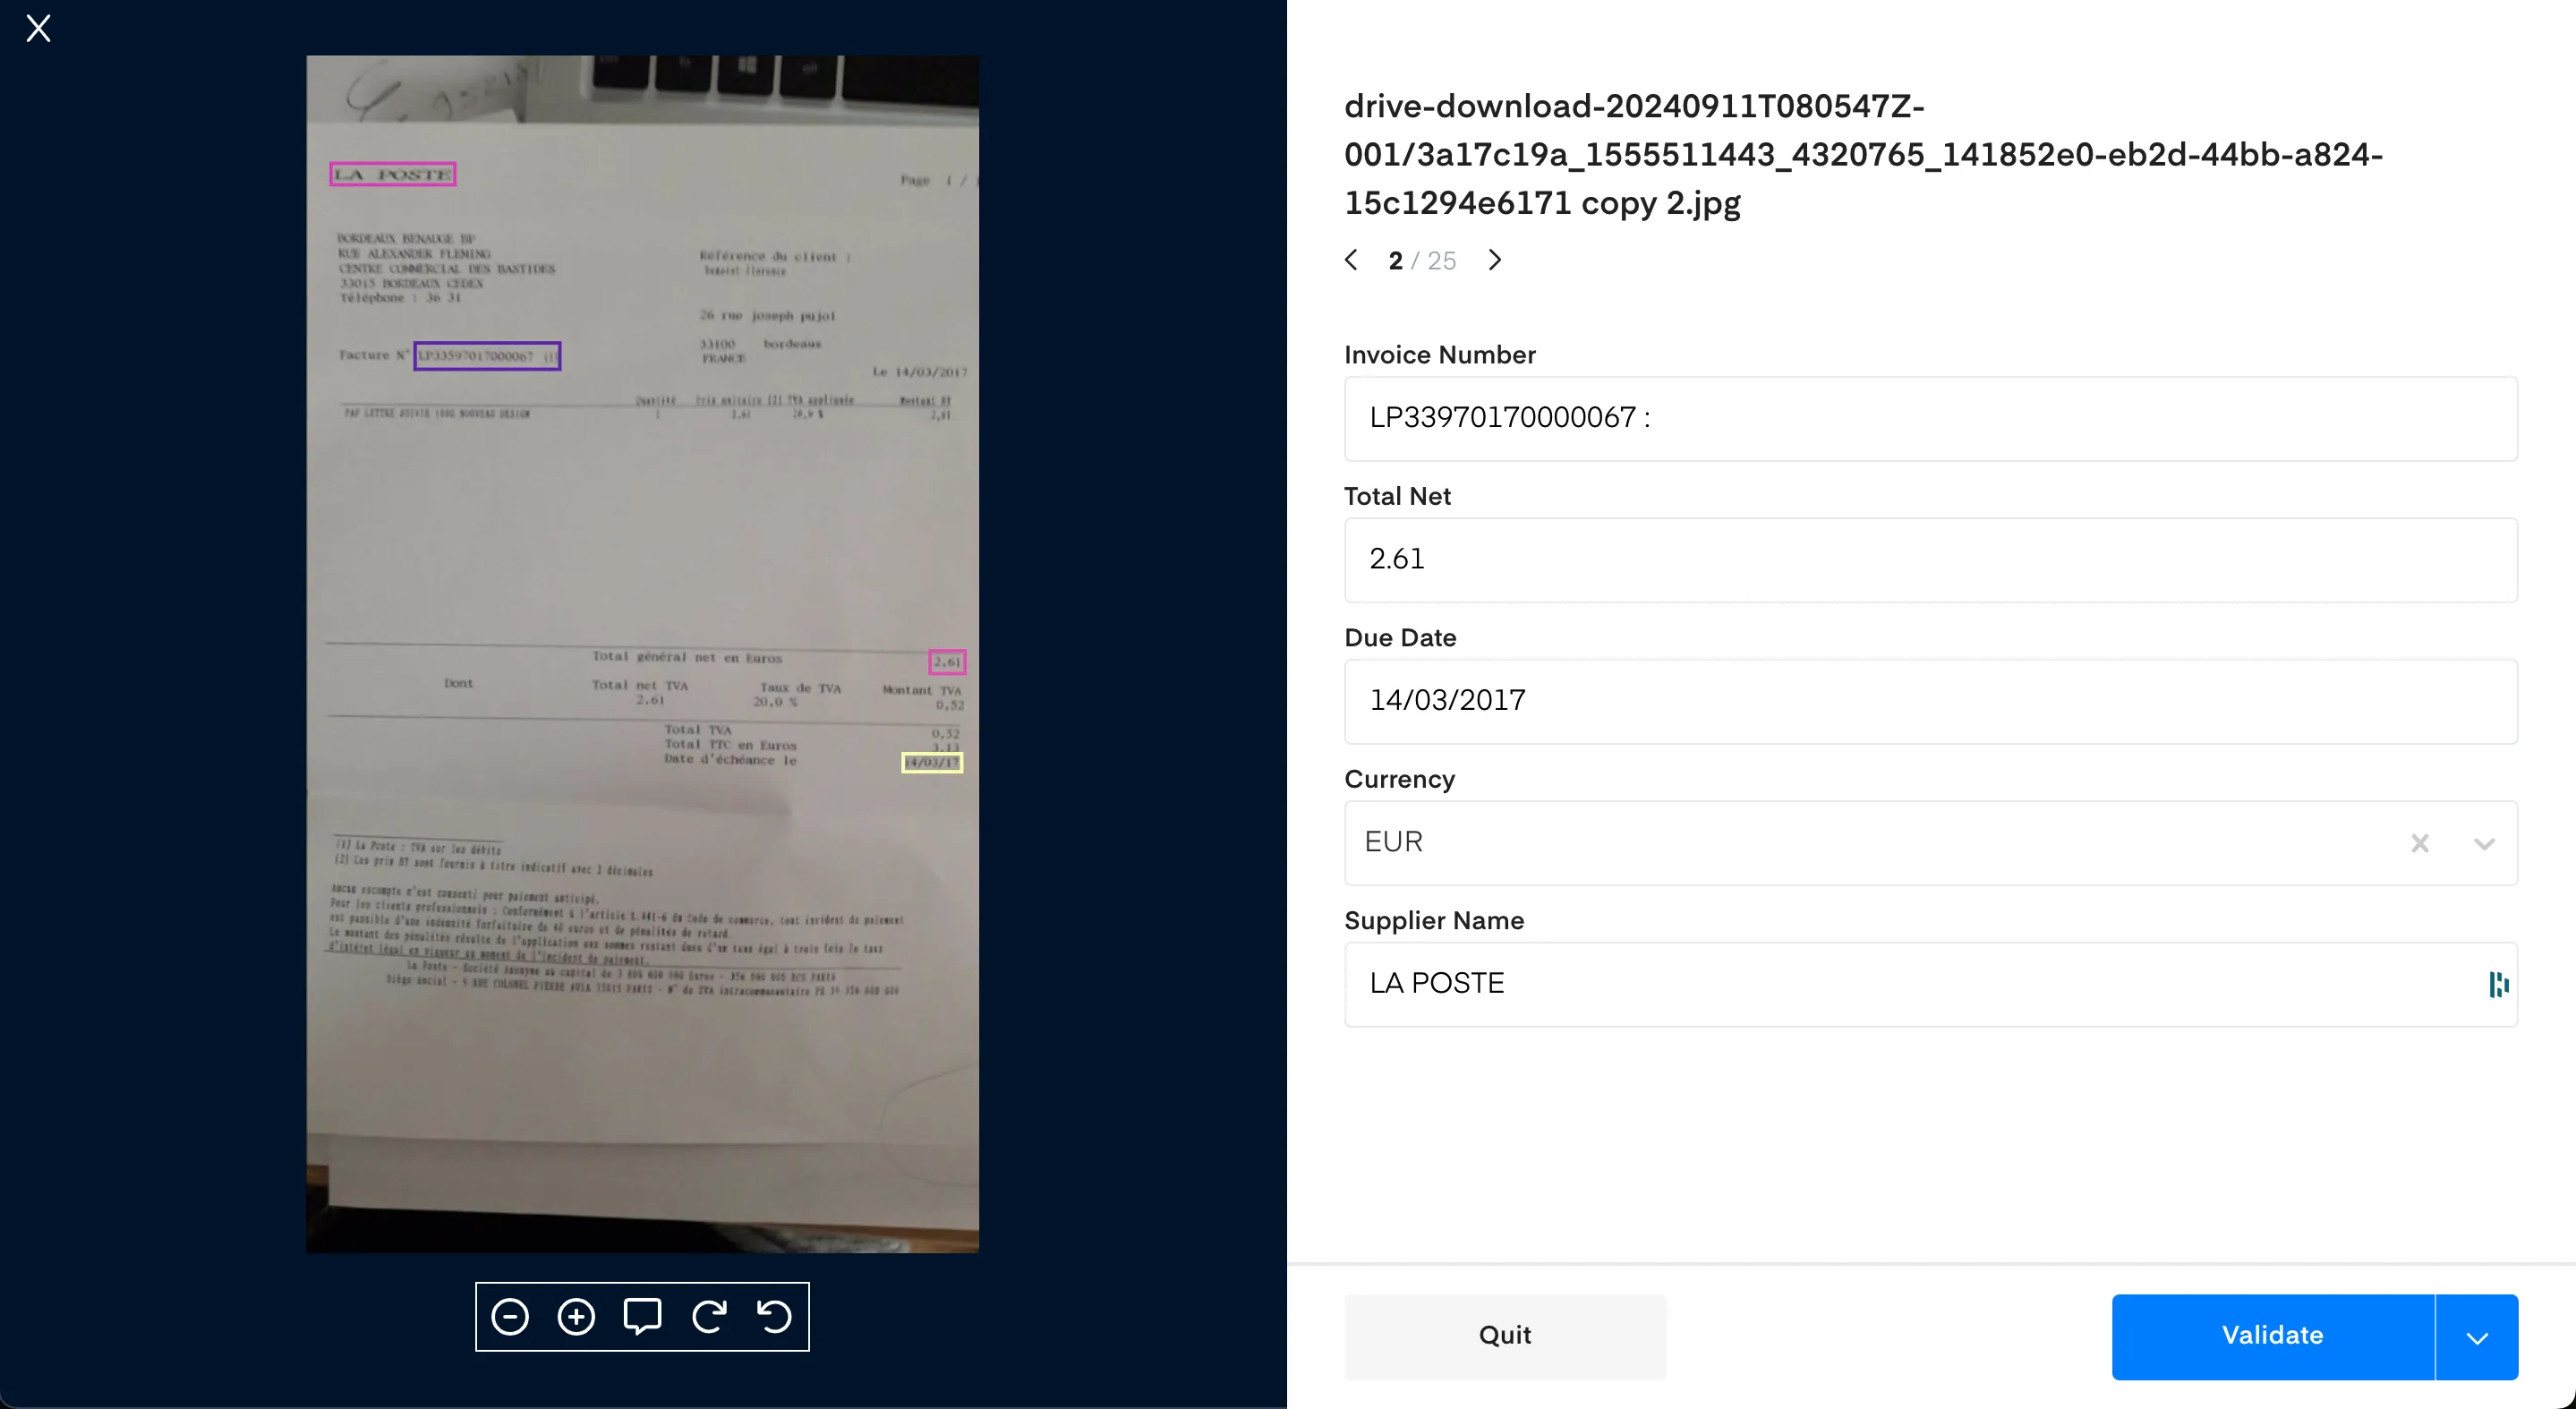
Independientemente de la solución que decidas utilizar, el entregable final de esta fase es recopilar las anotaciones en un formato utilizable para tu herramienta de benchmark. En nuestro ejemplo, utilizando la hoja de cálculo, debes ver una línea para cada archivo, junto con los campos anotados para cada uno de ellos. Asegúrate de validar por última vez tu archivo para garantizar que no mezclaste nombres de archivo con anotaciones, por ejemplo, y estaremos listos para pasar al siguiente paso.
Realización del benchmark de OCR de recibos
Ahora que tienes tus recibos anotados, necesitamos comparar los resultados del OCR de recibos con tus anotaciones. Para ello, definiremos algunas métricas que pueden ser relevantes para tu caso de uso, junto con su valor de negocio.
Haz clic a continuación para descargar la herramienta gratuita de benchmark de OCR de Mindee y comienza tu evaluación hoy mismo.
Descarga la herramienta gratuita de benchmark de OCR
¿Qué métricas utilizar?
Extraer datos de recibos mediante un OCR no es un fin en sí mismo. Algunos casos de uso del OCR pueden ser, por ejemplo:
- Rellenar automáticamente un formulario que será validado por sus usuarios, sin la molestia de recuperar toda la información ellos mismos de los recibos originales.
- Automatizar completamente un proceso que requiere datos de imágenes de recibos sin intervención humana.
- Recopilar datos de una base de datos de recibos para extraer información sobre los tipos de compras.
Dependiendo del caso de uso, las métricas a calcular pueden diferir porque su valor de negocio es distinto. Intentaremos definir algunas métricas importantes y explicar cómo pueden traducirse en valor de negocio en las siguientes secciones.
Métricas a nivel de documento frente a métricas a nivel de campo
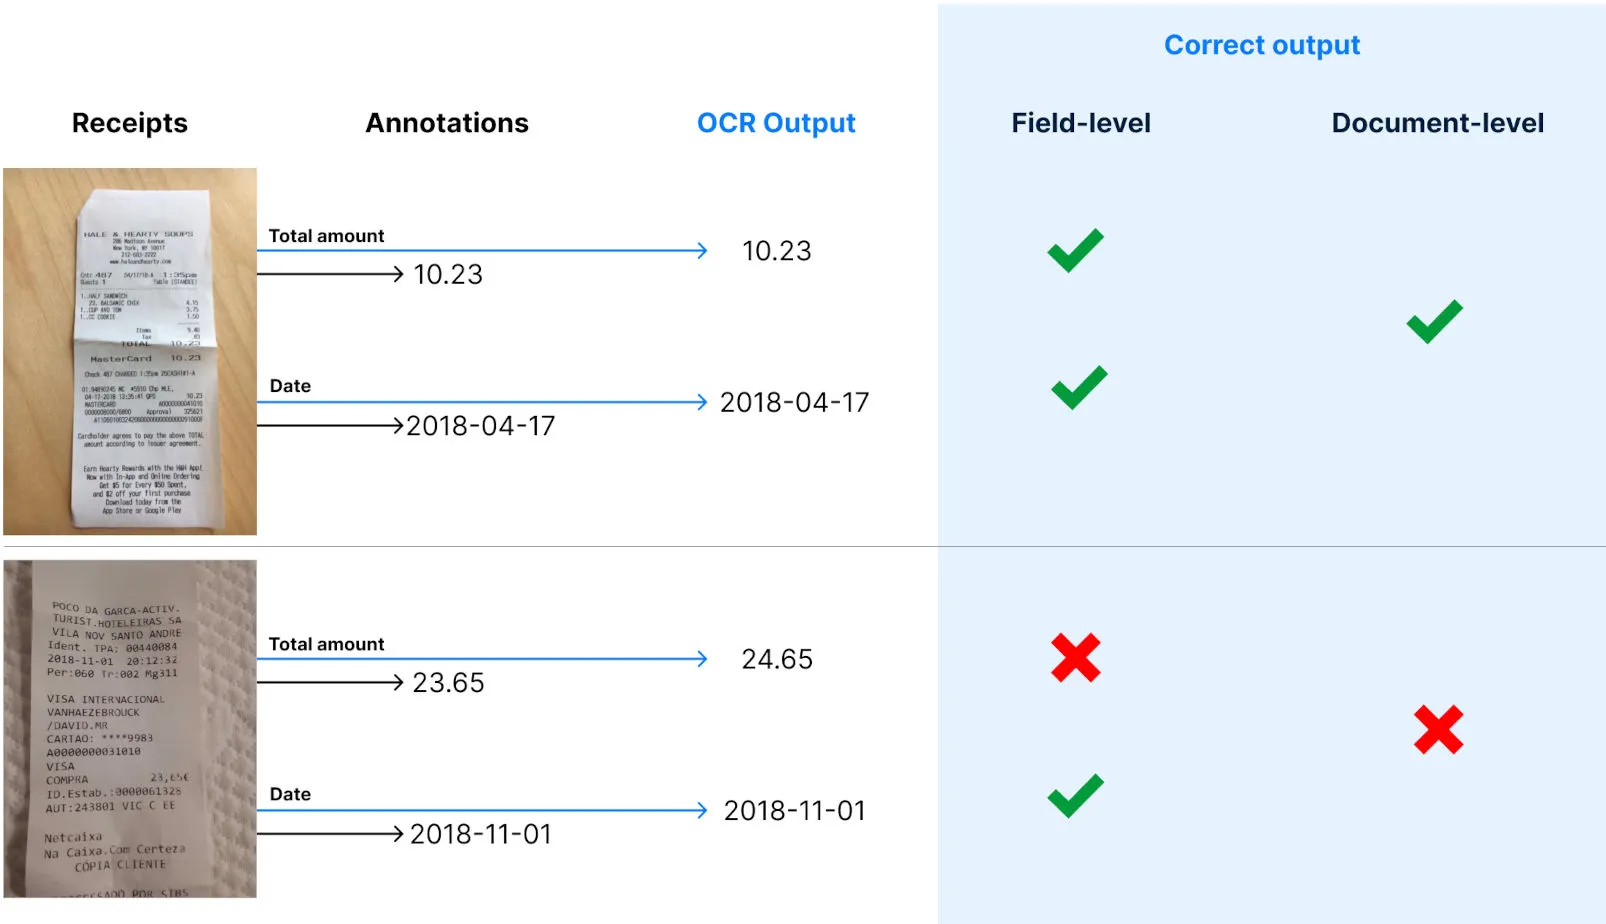
Antes de profundizar en las métricas, definamos dos alcances importantes que deben considerarse para calcularlas. El objetivo es establecer una distinción entre una respuesta correcta para el recibo completo o para un campo del recibo.
El nivel de documento se refiere a una salida correcta para el documento completo, lo que significa que todas las salidas de cada campo son correctas.
El nivel de campo es más granular y corresponde a un campo único dentro de un documento que es correctamente extraído por el OCR.
Precisión
La precisión es probablemente la métrica más común utilizada en estadística para calcular el rendimiento de los algoritmos. También es la más fácil de entender. Es simplemente el porcentaje de predicciones correctas (salidas del OCR) en un conjunto de datos.
Ejemplo: Tiene un conjunto de prueba que contiene 1000 recibos que se ajustan a su distribución de datos real, y está intentando calcular la precisión del OCR del recibo en el campo "Importe total". Si el OCR arrojó 861 respuestas correctas de los 1000 recibos, la precisión es del 86,1%. 1000 datos para la prueba corresponden a un margen de error del 3,2%. Puede concluir que, con una confianza del 95%, la precisión del OCR en la extracción del importe total estará entre el 82,9% y el 89,3%.
¿Qué significa esto en su caso de uso?
A nivel de campo, consideramos que la salida del OCR es correcta si es igual al campo anotado.
- Si su caso de uso es la precarga de un formulario que será validado por un usuario, este es el número promedio de correcciones que sus usuarios tendrán que hacer en este campo para obtener datos precisos. En otras palabras, si cree que corregir un campo lleva 12 segundos, puede asignar un valor de tiempo a la precisión a nivel de campo para cada campo.
- Si su caso de uso es una tarea de automatización completa sin intervención humana, la precisión a nivel de campo puede ayudarle a determinar qué campos son los cuellos de botella para mejorar la precisión a nivel de documento y tomar medidas al respecto para optimizar los resultados. Por ejemplo, si su flujo requiere automatizar la extracción de la fecha y el importe total, y tiene una precisión a nivel de campo del 74% y 94% respectivamente, sabe que su precisión a nivel de documento y, por lo tanto, su tasa de automatización no pueden ser superiores al 74%.
A nivel de documento, consideramos que la salida del OCR es correcta si todos los campos que le interesan son correctos a nivel de campo. La precisión, en ese caso, es la proporción de recibos que se extraerán de forma totalmente correcta.
- Si su caso de uso es el rellenado previo de un formulario que será validado por un usuario, esta es la proporción de recibos en los que sus usuarios no tendrán que corregir nada. En otras palabras, el resto de los recibos requerirán una acción de su usuario para corregir la extracción.
- Si su caso de uso es una tarea de automatización completa sin intervención humana, la exactitud a nivel de documento es simplemente la tasa de automatización correcta. Los resultados que contienen un error (100% - exactitud a nivel de documento) son muy peligrosos porque todos contienen un error y, por lo tanto, pueden conducir a una automatización basada en datos incorrectos. Para asegurar que la tasa de automatización correcta sea alta, la precisión es una métrica mejor.
Precisión
Exactitud y precisión son dos palabras que se confunden, y que no tienen el mismo significado en absoluto en estadística. Mientras que la exactitud es un indicador para responder a la pregunta "¿Cuál es el porcentaje de respuestas correctas?", la precisión responde a la pregunta "Cuando el OCR produce un resultado, ¿cuál es el porcentaje de resultados correctos?". Parece muy similar a la exactitud, y de hecho está correlacionada con ella. Pero como veremos, no tiene el mismo significado.
Para calcular la precisión, debe calcular la proporción de respuestas correctas, pero no en todo su conjunto de datos, solo en la submuestra en la que el OCR arrojó un valor no nulo.
Ejemplo: Tiene 1000 datos en su conjunto de pruebas y está intentando calcular la precisión del OCR en el campo "importe total". El OCR arrojó un valor para el importe total en 914 recibos y devolvió un nulo valor para los demás. De esos 914 recibos, el importe total se extrajo correctamente en 861 de ellos. Su precisión es entonces 861 / 914 = 94,2%. El margen de error es del 3,2% con 1000 datos, por lo que puede concluir que, con una confianza del 95%, la precisión del OCR en el campo "importe total" está entre el 91% y el 97,4%.
Como puede ver, la precisión y la exactitud son similares pero muy diferentes. Es posible tener una precisión del 100%, con una exactitud del 0,1%.
En sus casos de uso, la precisión puede ser reveladora:
A nivel de campo
- Si su caso de uso es el rellenado previo de un formulario que será validado por un usuario, la precisión corresponde al número de veces que habrá un autocompletado para ese campo, y el autocompletado es correcto. Si el OCR es muy preciso, el usuario no podrá cometer errores porque el campo no se rellenará en absoluto cuando haya un error, y el usuario no podrá omitirlo. Además, es más fácil corregir un campo vacío que corregir un campo que ya contiene algo. Una mayor precisión a nivel de campo también tiene un valor de tiempo porque corregir un campo es más rápido.
- Si su caso de uso es una tarea de automatización completa sin intervención humana, la precisión a nivel de campo no aporta mucha información, pero al igual que la exactitud a nivel de campo, puede ofrecer información sobre los campos que son los cuellos de botella para la métrica a nivel de documento.
A nivel de documento
- Si su caso de uso es el rellenado previo de un formulario que será validado por un usuario, la precisión a nivel de documento no es muy reveladora. Esto corresponde al porcentaje de recibos en los que los usuarios tendrán que rellenar los campos del formulario solo cuando estén vacíos, y, por lo tanto, no tendrán que corregir campos autocompletados. Pero se puede medir la cantidad de tiempo requerido para los dos casos, y aún puede haber una cantidad interesante de tiempo ahorrado al corregir campos vacíos frente a campos autocompletados incorrectamente.
- Si su caso de uso es una tarea de automatización completa sin intervención humana, la precisión a nivel de documento es crítica. Para esos casos de uso, preferimos que el OCR no arroje ningún resultado a que devuelva una respuesta incorrecta, porque todo está automatizado y el proceso continuará con datos incorrectos. Por esta razón, la exactitud no es muy importante, porque es muy probable que rechace una predicción que contenga un valor nulo, ya que sabe de antemano que no tiene todos los campos requeridos y eso conduciría a un error. Dado que el siguiente paso de su proceso automatizado puede ser muy peligroso con datos incorrectos, la precisión a nivel de documento le da el porcentaje de datos incorrectos que se utilizarán en el flujo automatizado. Tomemos el ejemplo de un caso de uso de automatización de cuentas por pagar. Usted recopila facturas en su aplicación e intenta automatizar completamente su pago. Tener una precisión a nivel de documento del 91% significa que sus clientes pagarán, el 9% de las veces, un importe que no es el importe correcto de la factura. Esto es obviamente imposible, y acercarse lo más posible al 100% es crucial.
Conclusión
Aquí tiene un resumen de las mejores prácticas a tener en cuenta cuando pruebe una tecnología OCR de recibos:
Sobre los datos
- 1.000 datos en tu conjunto de pruebas te darán una aproximación de la precisión con un 95% de confianza y un margen de error del 3%. Si no tienes 1.000 recibos, calcula la fórmula del margen de error para entender la precisión de tu evaluación comparativa.
- Selecciona datos que se ajusten a tu problema del mundo real. Si aún no tienes un flujo de producción, o si es difícil hacerlo automáticamente, intenta extraer patrones de tus datos que te ayuden a construir el conjunto de pruebas (Ejemplo: países, monedas, tipo de gastos, fechas, etc.).
- Realiza al menos 2 rondas de anotación de datos antes de medir el rendimiento, ya que el impacto de las anotaciones incorrectas puede ser muy significativo.

Acerca de

.svg)


.webp)
.webp)
.webp)